What It Does
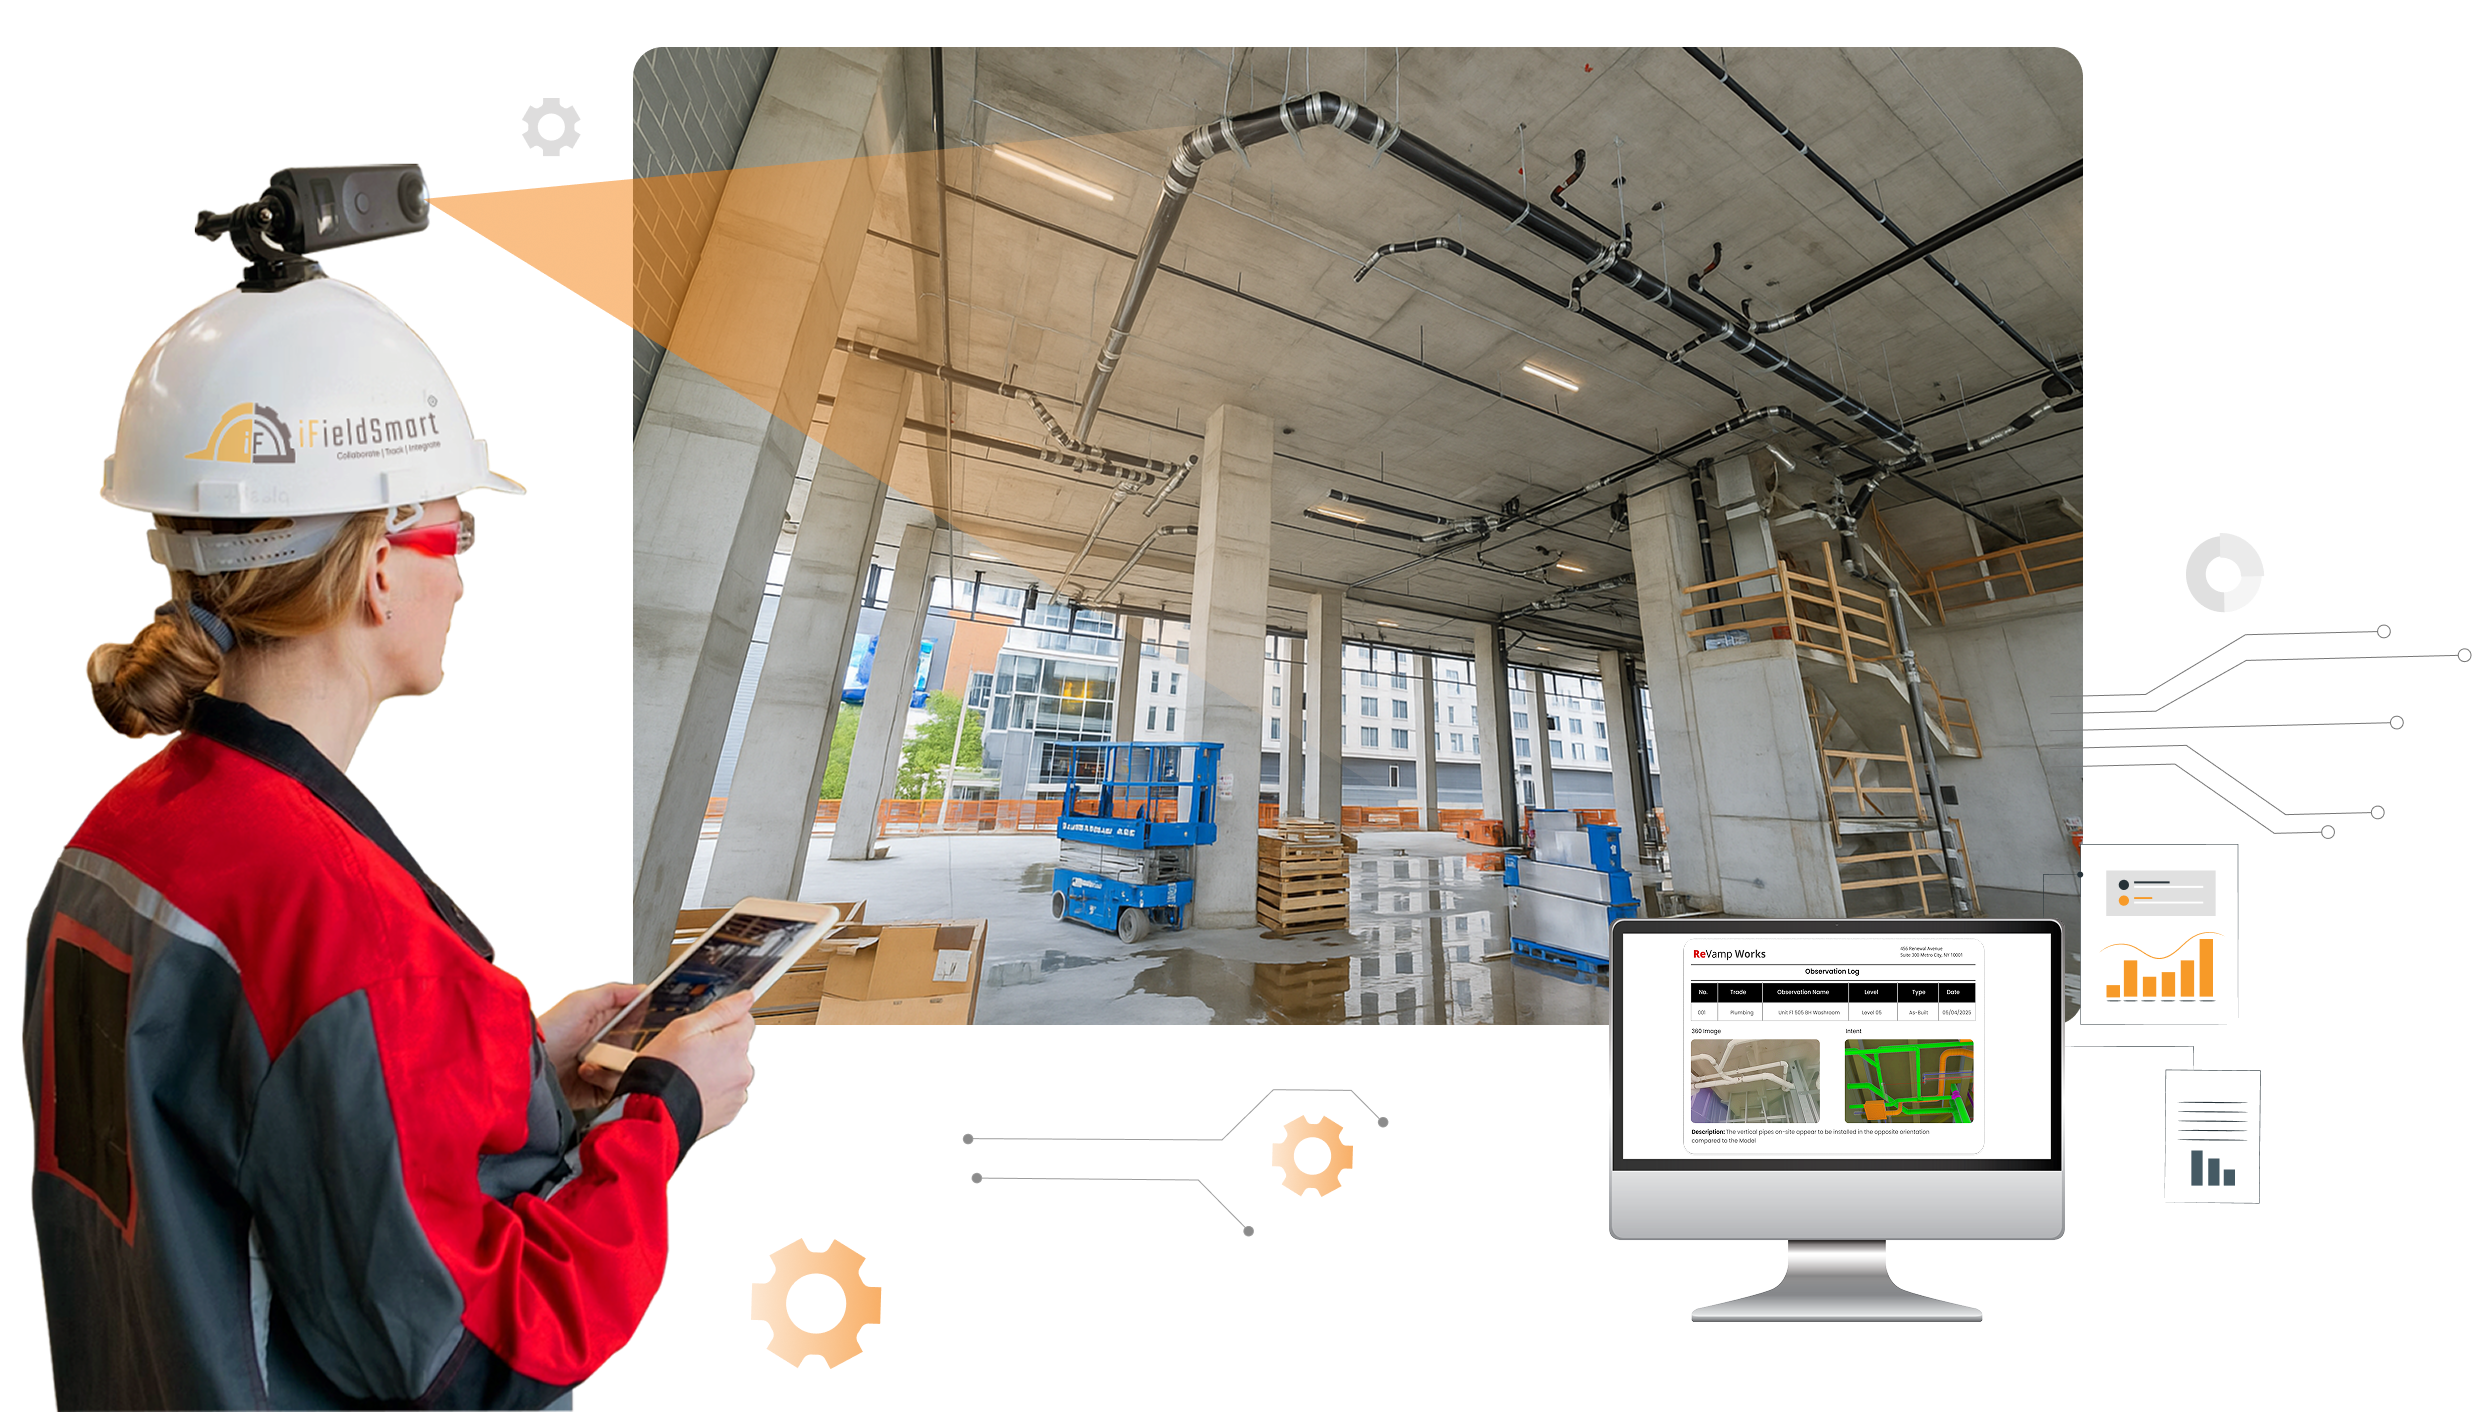
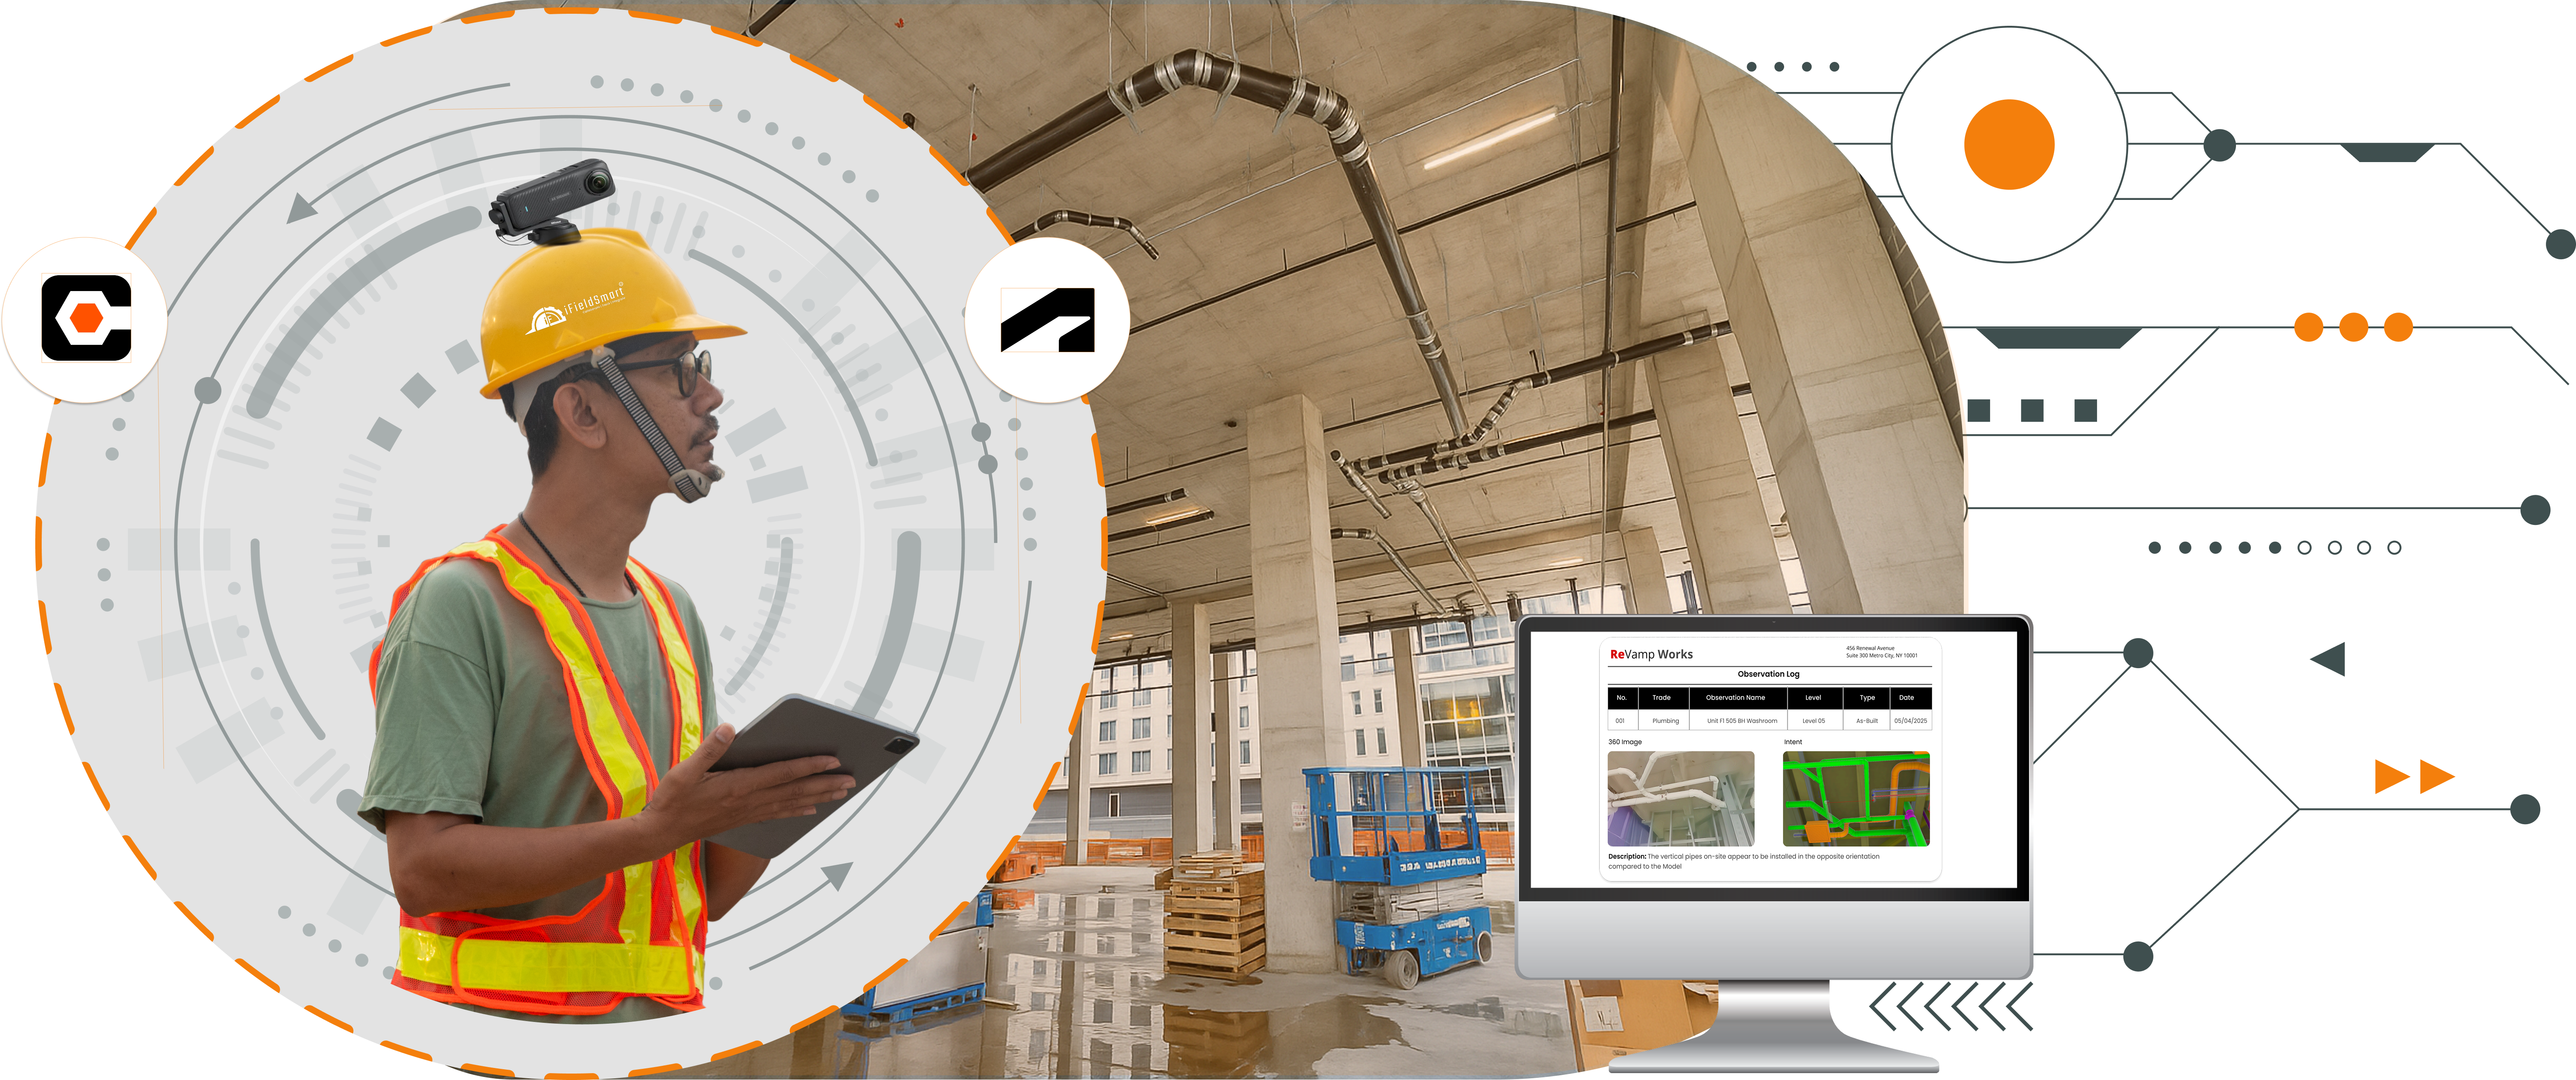
Trade-Wise Visual Progress Tracking
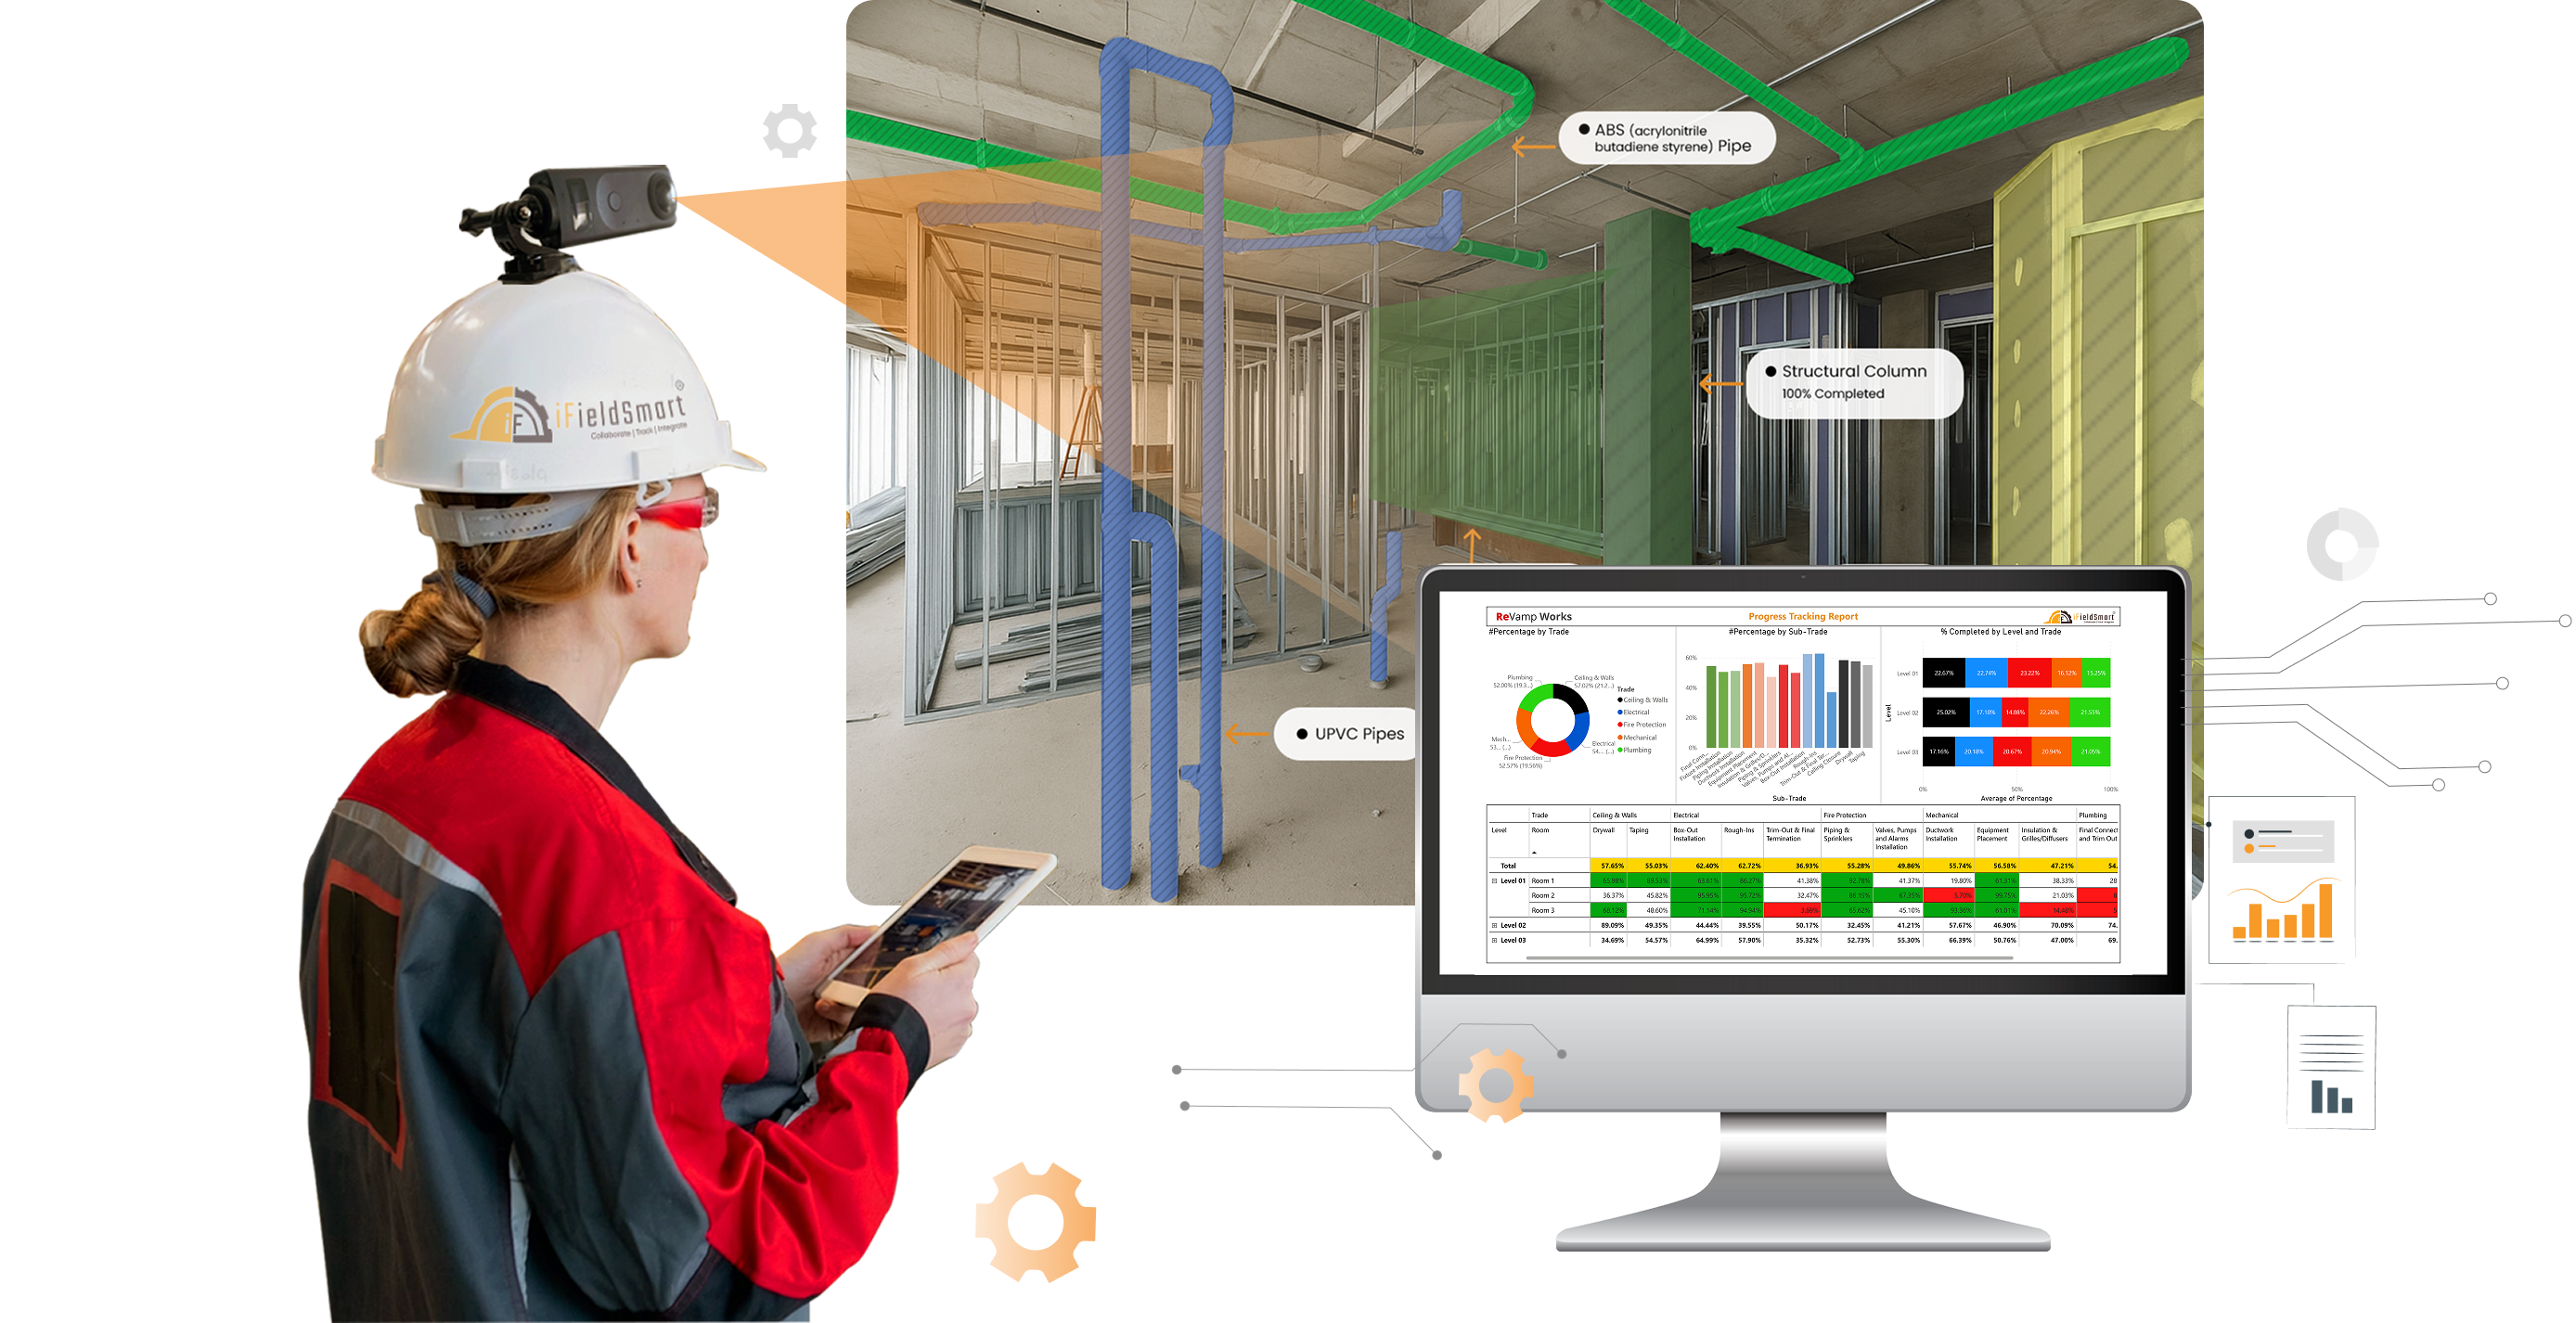
Get Actual Work Status — Not Just What’s Claimed
- Get Actual Work Status — Not Just What’s Claimed
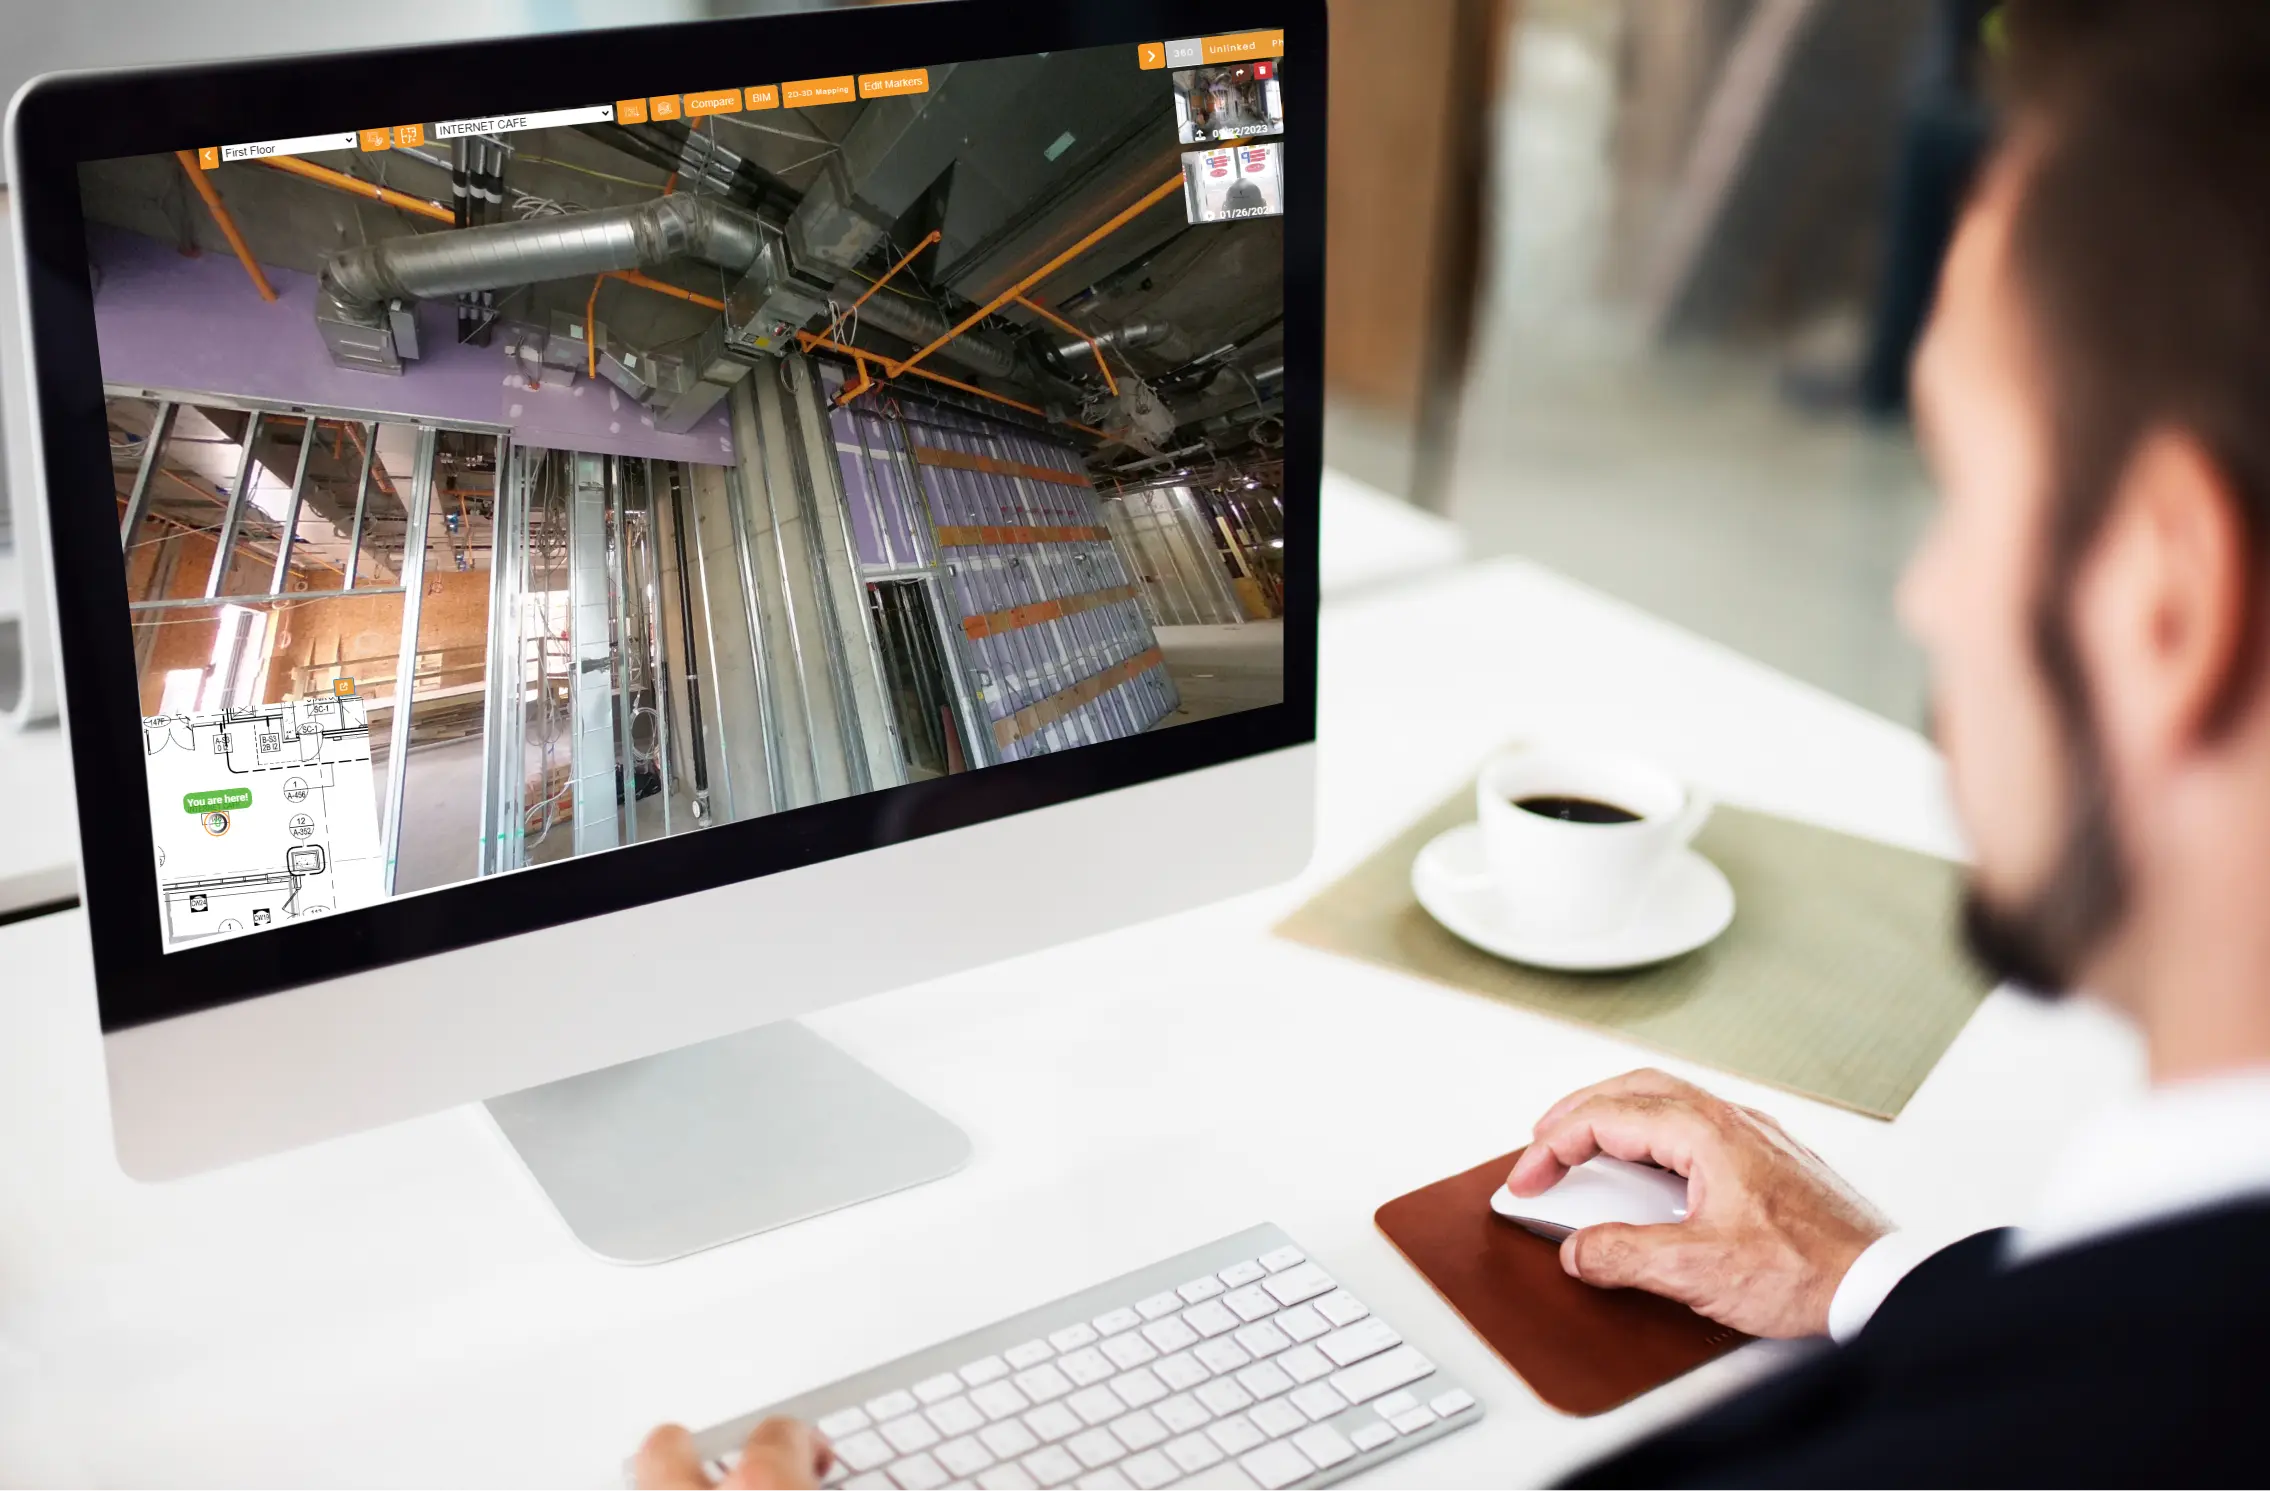
- Break down progress by trade, location, or scope
- Know what % of work is complete, delayed, or unstarted
- Filter by floor, system, room, or subcontractor